How to Move on When Your Students' AP Scores were Low
4 min read•december 17, 2021
How to Move on When Your Students' AP Scores were Low
Your students’ AP scores were low. What do you do now? Presumably, you're pretty upset. But, keep in mind that these are your students’ scores, not yours. You didn't take the test, they did. Their scores are not a reflection of your value.
However, the teacher still holds a great deal of responsibility towards his/her students' scores. Students, parents, and administrators will point to the teacher. In fact, low AP scores often lead to a lack of confidence in the teacher. Increasing AP scores begins with understanding why students scored as they did.
Many factors out of your control contribute to low scores.
Student buy-in contributes to scores. Many students are in Advanced Placement for the wrong reasons. Some are seeking GPA points and never intend to submit the score to colleges, much less prepare and take the AP exam. Others are not particularly interested in advanced courses, yet they take them with friends. Still, others are meeting requirements by taking AP courses for local programs. What can you do to combat “AP Campers?”
Increasing student engagement is the first step.
Add in history mystery lessons, connect the past to present-day issues, give options for assignments and projects, and poll your students. Ask them what topics interest them or what activities they enjoy the most. Using surveys to inform your lesson planning fosters student engagement and ownership of individual learning.
And then there are the students who nap during the AP exam or decide to not write the essays. I know strong and weak students who have left most of the test blank. Weaker students often feel defeated before the test evens starts, but why do capable students give up? A lack of confidence often drives students to undermine themselves by not attempting the exam or parts of the exam. They would rather know why they failed rather than attempt to pass the test and suffer disappointment when scores come out.
Building student confidence is a must.
Students need to feel successful in order to accomplish difficult learning tasks. Scaffold the most difficult tasks and give specific feedback. Jumping into DBQ essays without practicing document analysis and other components such as thesis and contextualization will only overwhelm your students. Practicing the components of the AP exam consistently builds student confidence and ensures that they are not surprised by a new challenging task during the test. Small achievements grow into motivation and confidence.
What about the factors in your control?
Teachers must focus on what they can control. Educators control the rigor, the climate in the classroom, homework, and more. The single most significant factor within the teacher’s control is teaching the skills and content required for the AP exam. The CED provides everything from content, examples, themes, and skills for your subject. Every teacher I know relentlessly pours over the CED when planning. However, not all delve into their instructional planning report.
The Instructional Planning Report from the College Board provides the data necessary to increase student scores.
The planning report remains the most informative feedback and should guide every single lesson for the following year. Let’s take a look at how to read the report for AP World History.
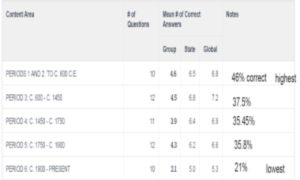
The Notes section is left blank on the original report. Since each time period has an unequal number of questions, you must generate the percent of questions answered correctly and record it in the notes section. Divide your group’s number of correct answers by the total number of questions, then multiply by 100 to get the percentage. In this case, 4.6 divided by 10 equals .46, then .46 multiplied by 100 is 46%.
Calculating the percent correct allows you to see which time periods students scored higher on. For the example above, Periods 1 and 2 were highest and Period 6 was lowest. Why was Period 6 the lowest? Here is another great opportunity to survey your students.
Student surveys offer the missing link to your data.
On the last day of school, I give my students an anonymous Google Form and ask if they answered all of the multiple-choice, what sections they thought were the hardest, which essay questions they chose, and whether or not they answered the essays. My guess was that many of these students ran out of time and did not finish answering the multiple-choice questions. Since the test is in chronological order, Period 6 had the lowest percentage of correct answers.
Timing all assessments is imperative whether you are giving a quiz, exam, SAQ or essay. Students must learn to answer the questions within the allotted time. I give extra time at the beginning of the year, but I quickly start to shave off minutes. Another strategy is recommending that students work backward. Students are more familiar with Period 6 as it is the last content covered. So why not work backward and save the older, less familiar content for last? Surprisingly though, these students performed better on the earliest content.
Again, make sure to poll your students. Perhaps they worked harder at the beginning of the year and understood those concepts the best, or perhaps they reviewed the earlier periods more. I suspect there was some test fatigue at play as well.
Self-reflection is the final step to success.
Finally, reflect on how you taught throughout the year. How did you teach each time period? Did students seem to perform better when they completed in-depth projects or intense writing? Did you review each time period differently?
A little reflection along with some student reflection will prove insightful. Students are often brutally honest if you offer an anonymous survey. Try it out next year and see if you can identify some trends. Then, adjust your teaching accordingly.
Check back here soon for a look at the written portion of the Instructional Planning Report!
How to Move on When Your Students' AP Scores were Low
4 min read•december 17, 2021
How to Move on When Your Students' AP Scores were Low
Your students’ AP scores were low. What do you do now? Presumably, you're pretty upset. But, keep in mind that these are your students’ scores, not yours. You didn't take the test, they did. Their scores are not a reflection of your value.
However, the teacher still holds a great deal of responsibility towards his/her students' scores. Students, parents, and administrators will point to the teacher. In fact, low AP scores often lead to a lack of confidence in the teacher. Increasing AP scores begins with understanding why students scored as they did.
Many factors out of your control contribute to low scores.
Student buy-in contributes to scores. Many students are in Advanced Placement for the wrong reasons. Some are seeking GPA points and never intend to submit the score to colleges, much less prepare and take the AP exam. Others are not particularly interested in advanced courses, yet they take them with friends. Still, others are meeting requirements by taking AP courses for local programs. What can you do to combat “AP Campers?”
Increasing student engagement is the first step.
Add in history mystery lessons, connect the past to present-day issues, give options for assignments and projects, and poll your students. Ask them what topics interest them or what activities they enjoy the most. Using surveys to inform your lesson planning fosters student engagement and ownership of individual learning.
And then there are the students who nap during the AP exam or decide to not write the essays. I know strong and weak students who have left most of the test blank. Weaker students often feel defeated before the test evens starts, but why do capable students give up? A lack of confidence often drives students to undermine themselves by not attempting the exam or parts of the exam. They would rather know why they failed rather than attempt to pass the test and suffer disappointment when scores come out.
Building student confidence is a must.
Students need to feel successful in order to accomplish difficult learning tasks. Scaffold the most difficult tasks and give specific feedback. Jumping into DBQ essays without practicing document analysis and other components such as thesis and contextualization will only overwhelm your students. Practicing the components of the AP exam consistently builds student confidence and ensures that they are not surprised by a new challenging task during the test. Small achievements grow into motivation and confidence.
What about the factors in your control?
Teachers must focus on what they can control. Educators control the rigor, the climate in the classroom, homework, and more. The single most significant factor within the teacher’s control is teaching the skills and content required for the AP exam. The CED provides everything from content, examples, themes, and skills for your subject. Every teacher I know relentlessly pours over the CED when planning. However, not all delve into their instructional planning report.
The Instructional Planning Report from the College Board provides the data necessary to increase student scores.
The planning report remains the most informative feedback and should guide every single lesson for the following year. Let’s take a look at how to read the report for AP World History.
The Notes section is left blank on the original report. Since each time period has an unequal number of questions, you must generate the percent of questions answered correctly and record it in the notes section. Divide your group’s number of correct answers by the total number of questions, then multiply by 100 to get the percentage. In this case, 4.6 divided by 10 equals .46, then .46 multiplied by 100 is 46%.
Calculating the percent correct allows you to see which time periods students scored higher on. For the example above, Periods 1 and 2 were highest and Period 6 was lowest. Why was Period 6 the lowest? Here is another great opportunity to survey your students.
Student surveys offer the missing link to your data.
On the last day of school, I give my students an anonymous Google Form and ask if they answered all of the multiple-choice, what sections they thought were the hardest, which essay questions they chose, and whether or not they answered the essays. My guess was that many of these students ran out of time and did not finish answering the multiple-choice questions. Since the test is in chronological order, Period 6 had the lowest percentage of correct answers.
Timing all assessments is imperative whether you are giving a quiz, exam, SAQ or essay. Students must learn to answer the questions within the allotted time. I give extra time at the beginning of the year, but I quickly start to shave off minutes. Another strategy is recommending that students work backward. Students are more familiar with Period 6 as it is the last content covered. So why not work backward and save the older, less familiar content for last? Surprisingly though, these students performed better on the earliest content.
Again, make sure to poll your students. Perhaps they worked harder at the beginning of the year and understood those concepts the best, or perhaps they reviewed the earlier periods more. I suspect there was some test fatigue at play as well.
Self-reflection is the final step to success.
Finally, reflect on how you taught throughout the year. How did you teach each time period? Did students seem to perform better when they completed in-depth projects or intense writing? Did you review each time period differently?
A little reflection along with some student reflection will prove insightful. Students are often brutally honest if you offer an anonymous survey. Try it out next year and see if you can identify some trends. Then, adjust your teaching accordingly.
Check back here soon for a look at the written portion of the Instructional Planning Report!
Resources
© 2024 Fiveable Inc. All rights reserved.
AP® and SAT® are trademarks registered by the College Board, which is not affiliated with, and does not endorse this website.